A Negative Wall Carbon Footprint Needs Its Fossil Part Shown
In short: A negative wall carbon footprint is a production-stage result. Up to the factory gate, the negative biogenic entry for the carbon in the timber outweighs the other climate impacts inside the declared boundary. Believe it once the fossil and biogenic parts are declared separately, for the exact assembly you are buying.
A minus sign beside a wall's carbon figure is easy to misread. Skim it and you picture a wall that keeps pulling carbon out of the air for as long as it stands. Read it properly and it describes one stage of an accounting method, a method that already has a later reversal written into it.
How much weight should that negative figure carry when you choose a wall? Our answer: real weight at the production stage, once you have seen it split into fossil and biogenic carbon and tied to the build-up on your drawings. Before that, next to none.
You should know where we stand. TUUYA designs and manufactures solid timber houses in MHM and CLT, plus A-frame kits, glulam structures and saunas, and delivers them across Europe from Latvia. A flattering carbon number suits us. Hold our figures to the same checks as anyone else's.
The declared unit has to be the wall you are buying
A carbon figure per square metre of wall means something only when that square metre is your wall. The declared unit says what the number covers. Sometimes that is the timber panel alone. Sometimes it is the panel with insulation, membranes, battens, cladding, fixings and the inner lining.
That gap matters. Mineral insulation, plastic membranes and metal fixings carry fossil emissions of their own and store little or no biogenic carbon. Leave them out and the panel figure looks more negative than the finished wall it turns into.
Ask which layers sit inside the figure, and at what thickness. Then compare walls only on the same declared unit and at comparable thermal and structural performance. A thin wall with a pretty number may need extra material on site to do the same job, and that material has a footprint too.
Production-stage figures stop at the factory gate
A production-stage figure covers modules A1 to A3 of a life-cycle assessment (LCA): raw material supply, transport of those materials to the factory, and manufacturing. It ends when the finished element leaves the gate.
Everything after that sits outside the number, declared separately if it is declared at all:
- Transport to your site (A4).
- Assembly on site (A5).
- Repairs and replacements during use (the B modules).
- Demolition, processing and disposal (the C modules).
- Benefits and loads reported beyond the system boundary (module D).
For a solid timber house delivered across Europe, transport deserves its own line. A heavy wall element travelling a long way by road adds emissions that no A1-A3 figure will show. So do the crane, the site plant and any concrete in the foundation.
A production-stage figure is still worth having. It covers the stage a manufacturer knows best and can document. It turns misleading the moment someone presents it as the footprint of the delivered, installed or demolished wall.
The fossil and biogenic split decides the wall carbon footprint
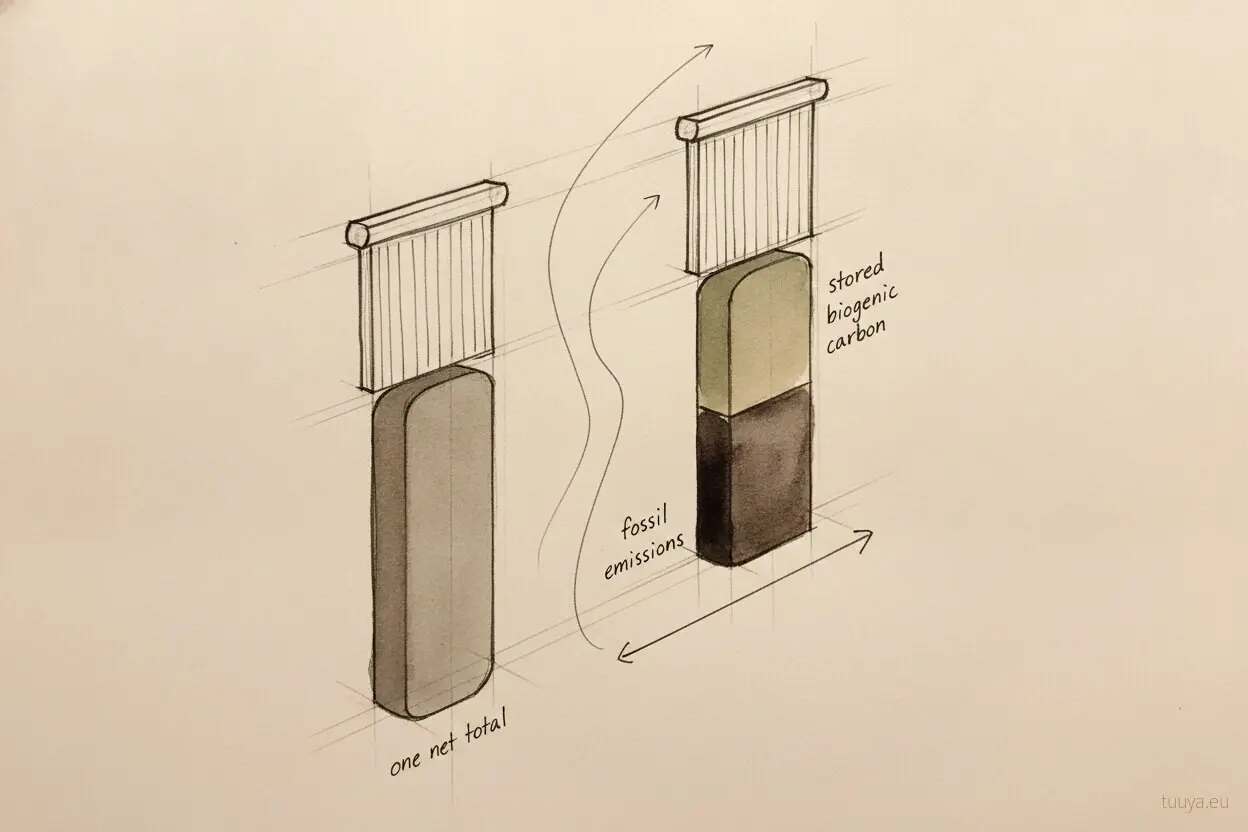
Growing trees take carbon dioxide from the air and hold the carbon in their wood. Life-cycle methods for construction products enter that uptake as a negative value. That entry is related to the mass of carbon held in the wood, but it is not the same quantity: it is a module's net biogenic result. When that negative entry exceeds the emissions counted for harvesting, sawing, drying, processing and hauling to the factory, the A1-A3 total drops below zero.
The result comes from the accounting and from the amount of wood in the product. It tells you nothing yet about how the fossil emissions of two walls compare.
Why a single total hides the useful part
EN 15804 is the European standard for Environmental Product Declarations (EPDs) of construction products. Its amended version, EN 15804+A2, is the one current declarations should be prepared to, and it requires the climate change result to be reported in parts:
- a fossil result
- a biogenic result
- a land use and land-use change result
- a combined total
The combined total is the negative number that ends up in brochures. Read the fossil line first. It is greenhouse gas from fuels, electricity and processing that has already reached the atmosphere, whatever later happens to the wood.
Two walls with the same negative total can have very different fossil parts. A wall with more timber and more energy-hungry processing can match another on the total while emitting noticeably more fossil carbon per square metre. That is the wall you want to catch before you sign.
End of life is where the stored carbon is booked out again
Under EN 15804+A2, the biogenic carbon credited at the production stage is booked as leaving the product system at end of life, in the C modules, under the end-of-life scenario the declaration assumes. That is an accounting entry, not necessarily a physical release: timber that is reused or recycled takes its carbon into the next product. So the negative entry at the production stage is no permanent climate credit. What a full cradle-to-grave account shows depends on that scenario. The fossil emissions of every stage stay in it regardless.
Physically, the carbon stays in the timber for as long as that timber remains in the building. The module approach in EN 15804 does not credit the time it spends stored, and other assessment methods value that storage in their own ways.
Whether the storage is worth anything beyond the bookkeeping comes down to whether the forest and the building's lifespan hold up their end. For a buyer reading a declaration, the practical point is narrower: expect the stored carbon to be booked out again at end of life.
A declaration that stops at A3 cannot show you that reversal. For timber and other products that contain biogenic carbon, expect a declaration to EN 15804+A2 to carry modules C1 to C4 and D; a lone A1-A3 figure does not replace it. Ask for C1 to C4 and D alongside A1 to A3.
Carbon shares the wall with structure, fire and moisture
A carbon figure is one line in a wall specification. It sits beside the lines that decide whether the wall works at all:
- structural capacity
- fire classification
- airtightness
- thermal performance
- how the build-up handles moisture
The last one is where carbon and performance collide. A wall with an attractive production-stage number and a thin moisture margin is a poor trade. If wet timber has to come out, its stored carbon leaves the building with it, and the replacement brings new fossil emissions. Ask about how much drying reserve the build-up keeps in the same conversation as the carbon figure.
Durability ties the two together. A wall that serves for generations spreads its fossil emissions over more years of use. A wall that needs early replacement adds a second production stage to the account.
Six documents that settle a wall's carbon figure
Each of these criteria comes down to a paper you can request from any manufacturer, us included.
| Ask for | Why it matters | Where it should appear |
|---|---|---|
| Declared unit and layer list | A panel-only figure leaves out the fossil emissions of insulation, membranes and fixings | The declaration or LCA report, stated per square metre of a named build-up |
| Modules covered | A1-A3 stops at the factory gate; transport, use and end of life sit elsewhere | The system boundary section of the declaration |
| Fossil, biogenic and land-use results separately | A negative total can hide a high fossil part | The results table, one row per indicator |
| End-of-life modules C1 to C4 | This is where the stored carbon is booked out, under the declared end-of-life scenario | The same results table, beside A1-A3 |
| Method and verification | A named method and third-party verification are the minimum before figures from two suppliers can be compared at all | The front page of the declaration, with the verifier named |
| Forest certification for the timber | Shows forest management and chain of custody, a separate question from the wall's footprint | A chain-of-custody certificate covering the supplied timber |
A leaf logo, a generic figure for sawn timber, or a declaration for a different product from the same factory answers none of these rows for your wall. FSC and PEFC certificates are worth asking for in their own right, because they evidence defined forest-management and chain-of-custody requirements. They do not measure the fossil emissions of a finished wall.
When the cheaper, less documented wall is the right call
A wall without a product-specific declaration can be the sensible choice, and on some projects the better one. Missing paperwork does not change the physics of a well-insulated, airtight wall. Three situations make the case:
- Carbon is not the deciding priority. A family planning a year-round home on a fixed budget, with no duty to report embodied carbon, can reasonably put the money into windows, insulation and a sound foundation first.
- The wall is a small share of the project. On a plot that needs a heavy concrete foundation, a long delivery or a long list of site trades, the wall's production stage may be a modest part of the total.
- Nobody will use the number. If no permit, lender or funding scheme asks for declared figures, and no whole-building assessment is planned, the extra documentation buys information rather than compliance. Requirements differ between countries and keep changing, so check them where you build, at the time you apply.
Picking the cheaper wall on these grounds is an honest priority call. The mistake is choosing it, or rejecting it, on the strength of a figure nobody has checked.
Our verdict: weigh the fossil line, not the minus sign
Give a negative production-stage figure weight only when the fossil, biogenic and land-use results arrive as separate lines. The declared unit also has to match your wall, layer by layer. And the end-of-life modules should be reported beside A1 to A3, not left for later.
With those in hand, and both walls doing the same job (functional equivalence), it is a fair basis for comparing walls at the production stage, with the fossil figure as the counterweight to a negative total. Without them, we would set the figure aside and decide on the wall's other merits. No single indicator proves one wall better.
Even a clean comparison covers the production stage only. A whole-life comparison adds transport to your plot, the foundation, site work and the building's expected service life, and it belongs in an assessment of the whole project.
Our walls face the same questions. Send us the build-up and the list of documents you need through the contact page, with your drawings attached, and we will tell you in writing which EPDs exist for the products in it and which do not.
Questions that come up before ordering
Can a figure per kilogram be compared with one per square metre of wall?
Only after conversion. A per-kilogram or per-cubic-metre figure describes a material. A per-square-metre figure describes a wall of a given thickness and build-up. Bring both to the same declared unit, with the same layers, before you put them side by side.
Does a thicker timber wall always show a more negative total?
More timber per square metre means more stored biogenic carbon, so the total tends to move further below zero. That is why the total is a weak guide to which wall is better.
Can a generic timber declaration stand in for a specific wall?
A generic or industry-average declaration shows what a typical product of that kind looks like. It does not describe the layers, thickness, energy supply or processing of the wall on your drawings. Use it for rough orientation, and ask for figures for the actual assembly.